
Advertisement
Advertisement
NASDAQ Index, SP500, Dow Jones Forecasts – Stocks Weaken Ahead of Powell; Tech Sector Leads Decline
By:
Key Points:
- S&P 500 drops ahead of February jobs report, Powell's testimony; Apple dips.
- Nasdaq falls nearly 2%; Apple, Tesla lead tech sector's significant decline.
- Dow's moderate drop driven by tech sell-off; Intel, Salesforce among top losers.

In this article:
S&P 500 Index
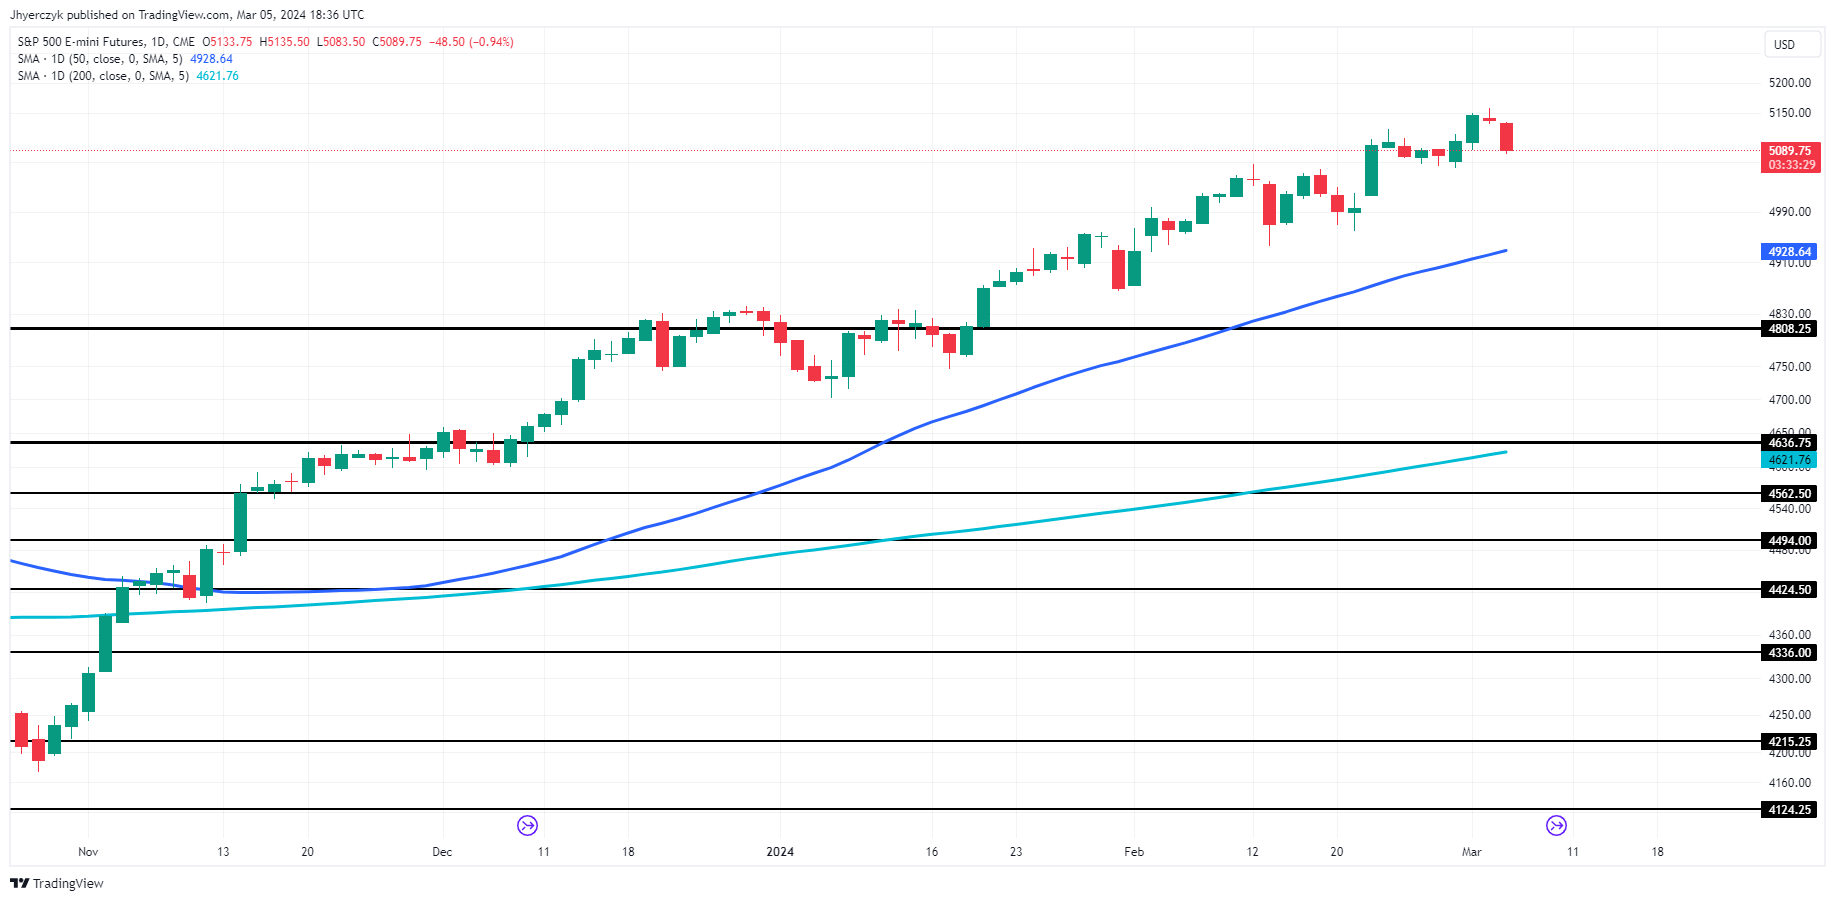
The S&P 500 Index is down, bracing for Friday’s February jobs report and Fed Chair Jerome Powell’s upcoming congressional testimony on Wednesday. Apple’s significant fall impacted the tech sector of the index. The S&P 500 had reached a new intraday high on Monday but closed marginally lower, setting the stage for Powell’s address to lawmakers.
Jay Powell’s Capitol Hill appearance is unlikely to surprise the market, as his post-Fed meeting message has been clear: interest rate cuts are planned for this year, but not as soon as expected.
With the earnings season over, markets are now more attuned to economic data. This focus, combined with a lack of other news, leaves the market prone to profit-taking after recent stock gains. Investors are exploring other areas for potential cash generation.
Recent economic reports indicate a slowdown in the U.S. services sector’s growth and a larger-than-anticipated decline in new factory orders.
Technically, one-day down from a record high does not make a trend change, but taking out the February 29 low at 5060.00 will change the short-term trend to down. If this move creates enough downside momentum then look for the selling to possibly extend into the uptrending 50-day moving average at 4928.72.
Nasdaq-100 Index

The E-mini Nasdaq-100 Index is down nearly 2.00% as we head into the final hours of trading on Tuesday.
Major stocks contributing to the downturn of the Nasdaq-100 Index included Apple, which dropped 2.7% following a report indicating a 24% year-on-year decline in its iPhone sales in China during the initial six weeks of 2024, amid heightened competition from local brands like Huawei.
Other leading growth and tech stocks also fell, with Tesla losing 4.9% after production at its Berlin Gigafactory was halted due to a suspected arson incident.
Microstrategy saw a 14.2% decrease after announcing a private sale of $600 million in convertible senior notes, planning to use the funds to purchase bitcoin.
Overall, the Nasdaq saw more declining issues than advancing ones, with a ratio of 1.54-to-1.
Technically, the key level to watch is the February 29 main bottom at 17826.00. A trade through this level will change the main trend to down and could trigger an acceleration into the 50-day moving average at 17455.19.
Dow Jones Industrial Average

The nearly 1% decline in E-mini Dow Jones futures was predominantly influenced by a sharp fall in Apple’s stock. This decline was a part of a broader tech sector sell-off that impacted the Dow. The Dow itself fell by 0.7%, a relatively moderate drop in comparison to other major indices, but this was largely due to the downturn in technology stocks. Leading the losses in the 30-stock index was Intel with a drop of more than 4%. Salesforce also experienced a notable decline, falling more than 3%, while both Apple and Microsoft each shed over 2%. Amazon wasn’t far behind, with a decrease of more than 1.5%. However, not all stocks in the average were negative; about two-thirds traded lower. In contrast, 3M and Walmart successfully defied the overall downward trend, each climbing more than 1%.
Technically, the blue chip average is within striking distance of its 50-day moving average at 38349. Trader reaction to this intermediate trend indicator will determine the near-term tone of the market.
About the Author
James Hyerczykauthor
James is a Florida-based technical analyst, market researcher, educator and trader with 35+ years of experience. He is an expert in the area of patterns, price and time analysis as it applies to futures, Forex, and stocks.
Did you find this article useful?
Latest news and analysis


Advertisement